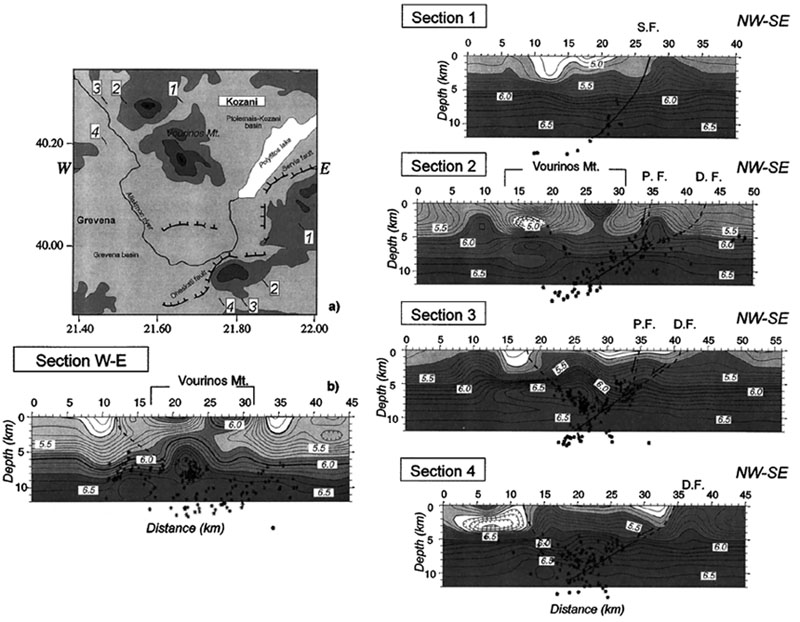
Left: (a) Map with the end points of the W-E section below and of the four, nearly parallel cross sections in right figure. (b) W-E vertical sectiono f the INV-A modelt hat crossesth e Vourinos massif. The shallow (0 to 3 km depth) velocity values as high as 6.0 km/s, indicate the extent of the ophiolites. A main E dipping thrust is located west of the Vourinos Mountain (between arrows).
Right: NW-SE vertical sections from northeast (section1) toward the southwest (section 4) across the fault that ruptured during the 1995 earthquake. Velocity contour is 0.1 km/s. Aftershocks located, with a precision of a few hundreds of meters, ±3 km distance from the section are plotted. The locations at the surface of the Servia (S.F.), the Dheskati (D.F.), and the Palaeochori (P.F.) faults are indicated. The geometry of the faults at depth is inferred from tomograms and aftershocks.
[from Chiarabba and Selvaggi (1997)].
|