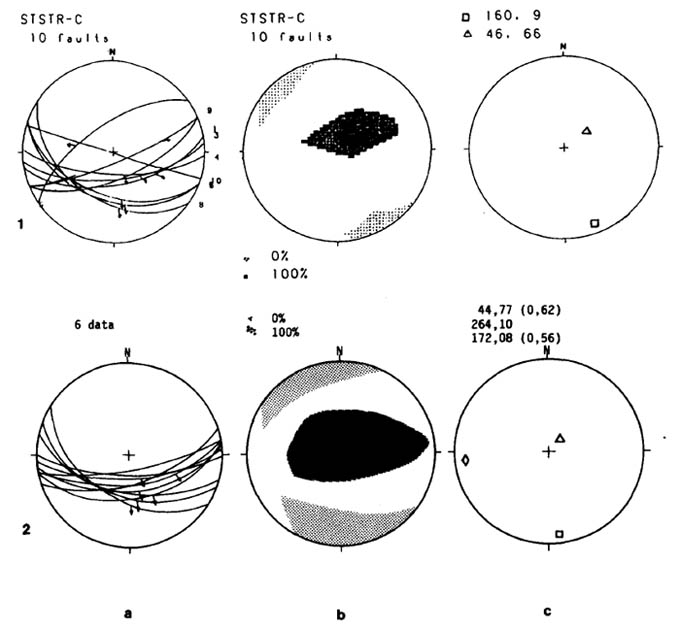
Structural data of the Ierissos-Stratoni region. Line 1 shows the data used and the results obtained for the neotectonic stress pattern of the wider seismogenic area. Line 2 shows data and results of the Stratoni seismic fault. Column a: stereonets with faults as cyclographic projections and striations as arrows. Column b: the application of the right-dihedra method (Angelier & Mechler 1977), dense shading-compressional area (ó1), light shading-extensional area (ó3). Column c: the results of the mathematical method of Caputo & Caputo (1988) showing the position of ó1 (triangles), ó2 (rombs) and ó3 (squares) principal stress axes.
[from Pavlides and Tranos (1991)].
|