
| DISS 3.2.GreDaSS: Seismogenic Source GRCS110 - Stratoni-Varvara | |
| Source Info Summary | Commentary | Pictures | References |
|
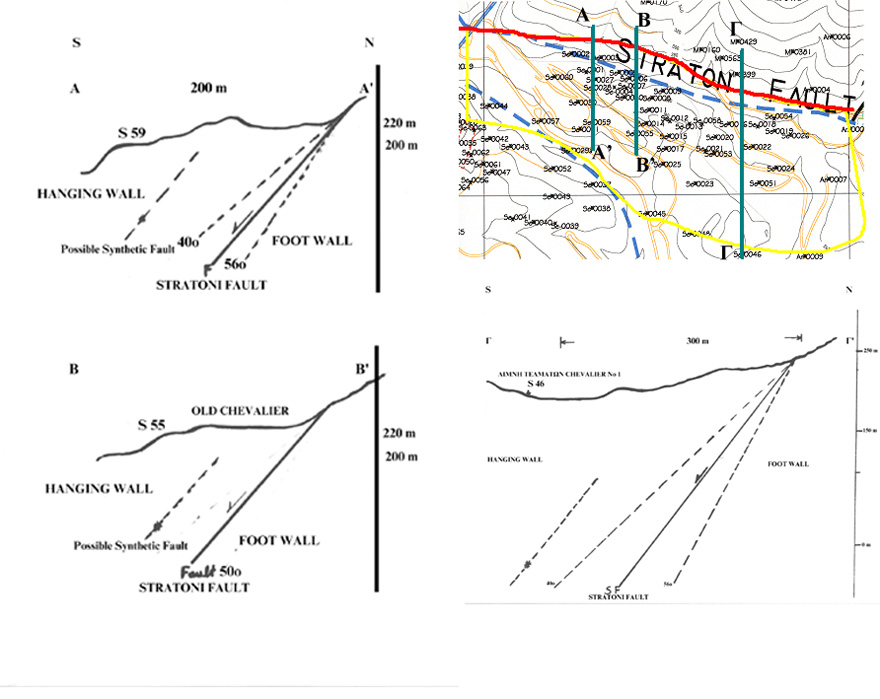
Map of the study area showing the fault trace (blue dashed line), the possible coseismic rupture of the 1932 earthquake (red line) and the area of ground deformation in case of future reactivation (yellow outlined area).
[from Pavlides (2001)].
|
 |