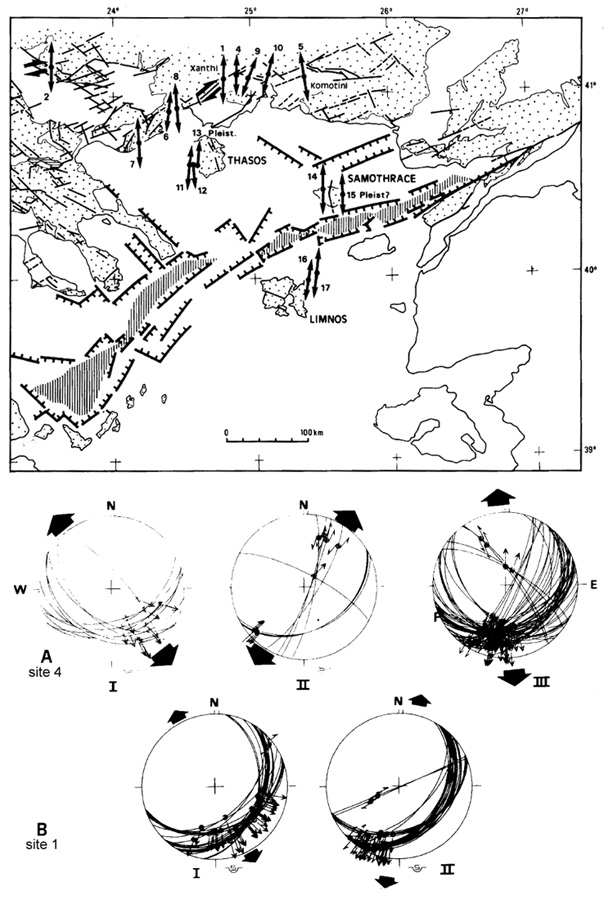
Top: Simplified tectonic sketch map of the North Aegean from Early(?) Pleistocene to Present. Black arrows indicate the main directions of extension resulting from the tectonic analysis of fault populations.
Bottom: Examples of striated fault planes along the Kavala-Xanthi major fault. Schmidt lower-hemisphere projections. Fault planes are shown as great circles, slickenlines as dots with small centrifugal arrows (normal motion) or double arrows (strike-slip motion). Large black arrows indicate the direction of extension (sigma3). A: site 4 and B: site 1 on figure above.
[from Lyberis (1984)].
|