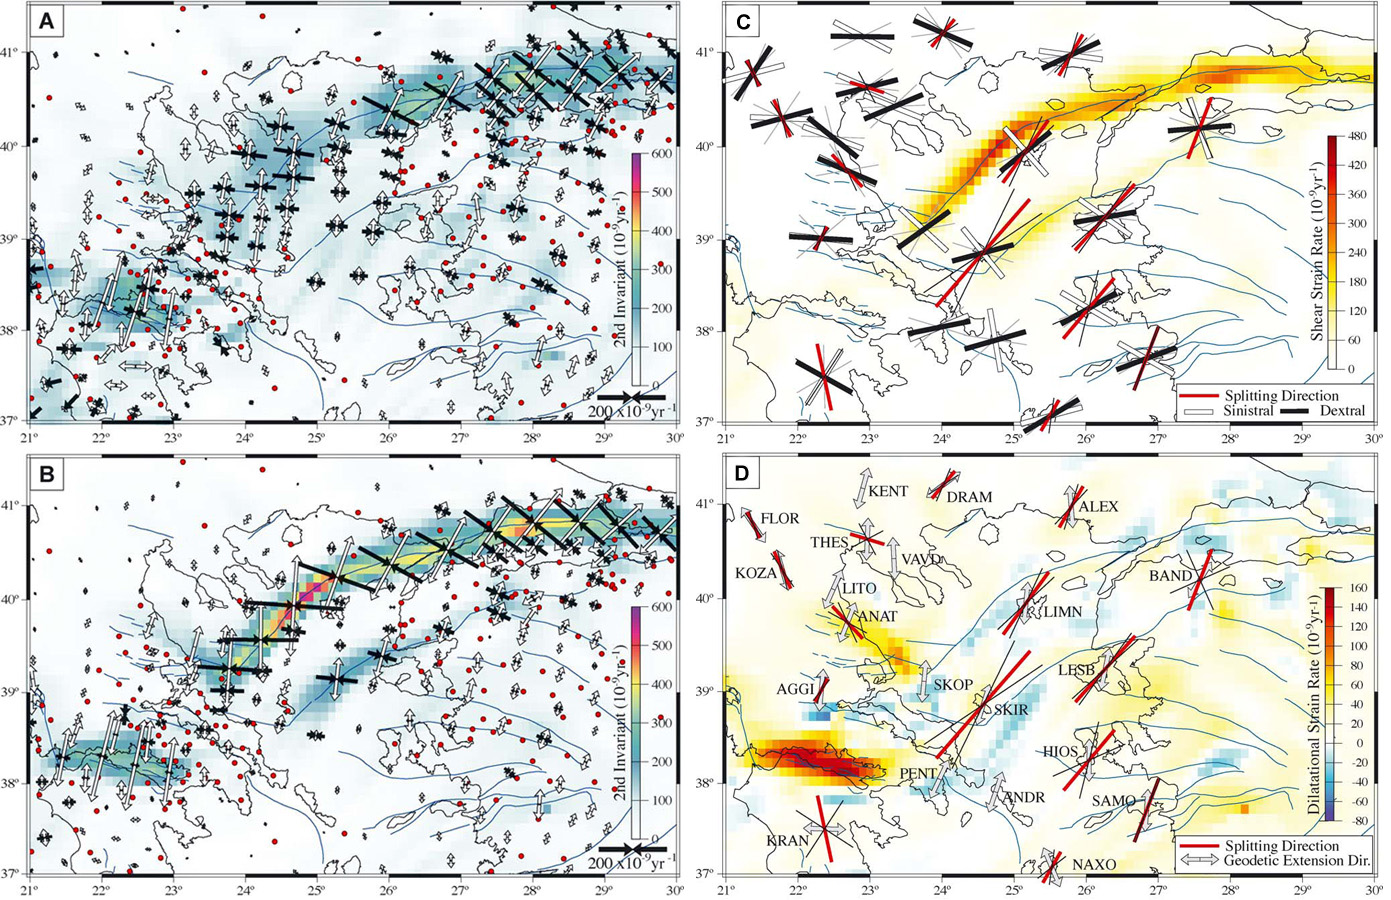
(A) Contour plot of the second invariant of the model strain rate field. Also shown are principal axes of the model strain rate field; white is extensional and black is compressional. This model is referred to as the GPS-alone model, because it is based solely on the interpolation of GPS velocities. Positions of used GPS velocities are shown by red dots, and major active faults are given as reference in blue.
(B) Same as in (A), but these results are for the preferred model. In this model, the GPS velocities have been interpolated but constraints from active faulting have been also used a priori.
(C) Contour plot of the shear strain rates associated with strain rate model in (A). Shear-wave-splitting results are shown by red bars (1-¾ angular uncertainties outlined by thin black lines). Also shown at all seismic stations are the orientations of no-length-change predicted by the model strain rate field; white and black bars reflect sinistral and dextral planes of shear, respectively. If the two bars are perpendicular, the planes of no-length-change are vertical and pure strike-slip is predicted. If the two bars overlap then the style of deformation is pure compressional or extensional and the no-length-change orientations are normal to the largest principal strain orientation. Thin grey lines outline 1-¾ angular uncertainty in no-length-change directions (for clarity, we only show uncertainties for the dextral direction). For reference, major active faults are shown in blue.
(D) Contour plot of the dilatational strain rate (positive is extensional) associated with strain rate model in (B). The shear-wave-splitting results are repeated as in (A) and we also show in grey the (averaged) predicted extension orientations at all seismic stations.
[from Kreemer et al. (2004)].
|